12 min to read
Your First SOC Investigation in Splunk: Find the Logs, Then Follow the Alert
Find your indexes, open your first events, and investigate a suspicious login one step at a time
PLAYBOOK FLOW
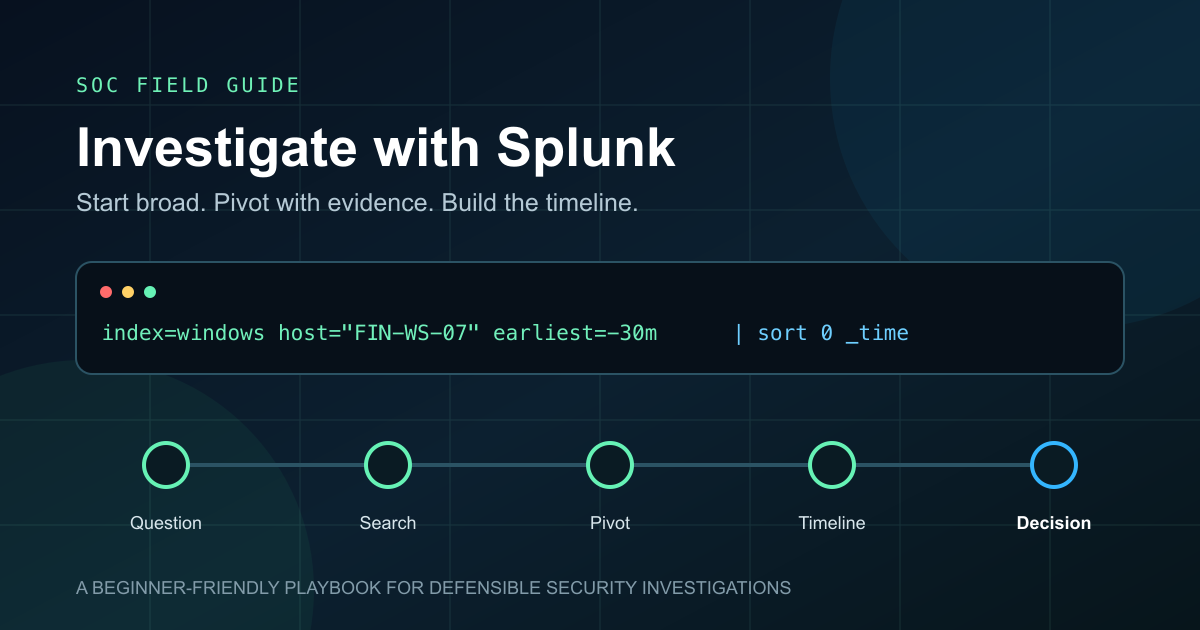
Investigation path
- 1Open Search & Reporting
- 2Find your indexes
- 3Identify the logs
- 4Read one event
- 5Follow the alert
- 6Explain the result
You Have Splunk Access. Now What?
You have just joined the SOC. Someone gives you Splunk access and asks you to investigate an alert.
You open the search screen. There is a search bar, a time picker, and a lot of unfamiliar names.
The first question is not “Which advanced query should I run?”
It is: “What logs do we have, and where do I find them?”
That is where this guide starts. We will find the available data, read a few events, and then work a suspicious-login ticket. No giant queries to memorize.
Before you start: your team must already be sending logs to Splunk and have given you authorized search access. This is not an installation guide. All example names, counts, and incident details are fictional. Searches use standard SPL, not SPL2; your screen and field names may differ.
1. Open the Search Screen
From Splunk Home, open Search & Reporting, then choose Search. If you land in a SOC dashboard instead, look for the app selector or ask a teammate where your team’s search workspace lives.
Find these four things:
- Search bar: where you write a search.
- Time picker: usually beside the search bar. Choose Last 24 hours while discovering data.
- Events: where individual log records appear after a normal event search.
- Fields sidebar: where Splunk shows information extracted from the results, such as hostname or username.
Some searches return a table under Statistics instead of individual events. That is normal: those searches summarize data.
If your screen has Data Summary, it can help you browse hosts, sources, and sourcetypes. Availability and visible data depend on your deployment and permissions. The search-based steps below work without that button. Splunk Search app overview.
2. Understand Four Words
Think of Splunk as a place where different teams send their logs. You need to know which collection to open and what kind of record you are reading.
| Word | Plain-language meaning | Example |
|---|---|---|
| Index | A named collection where events are stored | windows |
| Sourcetype | A label describing the event’s format/type | WinEventLog:Security |
| Source | The input, file, or stream supplying the event | A Windows event-log input |
| Host | The host value assigned to the event | FIN-WS-07 |
An event is one log record. A field is a named piece of information in it, such as EventCode=4625.
An index can contain several sourcetypes. Your Windows logs might live in windows, win_security, or something completely different.
One catch: host can identify a collector rather than the computer being investigated. Read an event to check. Splunk’s default fields.
3. Find Which Indexes Have Data
Paste this into the search bar and run it:
| tstats count WHERE index=* earliest=-24h latest=now BY index
| sort - count
You do not need to learn all of tstats yet. Here it is a shortcut: count searchable events in matching indexes during the last day. It uses indexed information rather than displaying every raw event. Splunk tstats reference.
The leading | is intentional. Look under Statistics. You might see:
| index | count |
|---|---|
| firewall | 82000 |
| windows | 34000 |
| endpoint | 19000 |
| dns | 12000 |
These are made-up results, not indexes that Splunk automatically creates for a SOC.
What you learned: these indexes have matching events you can access in that window.
What you have not learned: whether you can see every index or whether collection is healthy. This is not a complete inventory of empty indexes, older-only data, internal indexes, other data types, or data your role cannot access.
If the search is denied or empty, ask which security indexes your role can search. Do not change permissions or ingestion settings to make a tutorial work. In a large environment, ask for the approved index list before repeatedly searching broadly.
4. Find Out What Is Inside an Index
Suppose your results include windows. Ask: what types of logs are inside it?
| tstats count WHERE index=windows earliest=-24h latest=now BY sourcetype
| sort - count
Replace windows with a name from your results. You might find:
| sourcetype | What to check for |
|---|---|
WinEventLog:Security |
Windows security events, including logons |
WinEventLog:System |
Operating-system and service events |
XmlWinEventLog:Microsoft-Windows-Sysmon/Operational |
Sysmon endpoint activity, if collected |
Names are clues, not proof. Confirm the content. For our login investigation, we want the Windows Security log.
If the alert were about a suspicious domain, we would first look for DNS or proxy logs. You do not need every data source for every alert.
5. Open Your First Few Events
Stop counting and read the logs:
index=windows sourcetype="WinEventLog:Security"
earliest=-24h latest=now
| head 20
This displays a small sample. head 20 helps you get familiar with the data; it does not prove that only 20 events occurred.
In Events, expand a record and look at its timestamp, raw text, and extracted fields:
- Which computer recorded it?
- What happened?
- Which account was involved?
- Is there a source IP?
- What are the exact field names?
For this walkthrough, assume we verified that:
hostidentifies the Windows computer, not a collector.EventCodecontains the Windows event number.TargetUserNameandTargetDomainNameidentify the account involved.IpAddresscontains the recorded source address when available.
Your add-on might use EventID rather than EventCode. Use what you actually see. If the raw record contains information but no extracted field exposes it, ask for help with extraction rather than guessing.
Checkpoint: you should now be able to say, “Our Windows Security logs are in this index, under this sourcetype, and these are the account and host fields.” That is your starting point.
6. Now Open the Alert Ticket
Here is our fictional ticket:
Ticket:       SOC-2026-0903-017
Alert:        Repeated failed Windows logons
Alert time:   2026-09-03 14:11 UTC
Account:      LAB\alex.morgan
Target:       FIN-WS-07
Source IP:    198.51.100.44
Rule reports: 24 failures within 10 minutes
Status:       New — successful access not yet confirmed
The IP is from a documentation-only range, not a real indicator to block.
Maybe someone is guessing a password. Maybe a service has stale credentials. Maybe a user mistyped a password. The alert is a claim to investigate, not a verdict.
Set the time first
Set a custom range of September 3, 2026, 14:00–14:20 UTC. Ensure your Splunk user timezone is UTC, or enter the equivalent local times.
All investigation searches below use that picker range. They intentionally contain no time modifiers. Remove the earlier earliest and latest settings when switching to them. Time modifiers in SPL override the picker; “last 24 hours” is relative to when you run the search, not to the alert. Splunk time modifiers.
Start with the computer
index=windows sourcetype="WinEventLog:Security" host="FIN-WS-07"
Run this first. Do we have events for the computer during the incident window?
If not, check the index, hostname format, source, time, and permissions. A short hostname may be stored as a fully qualified name. Do not keep adding filters to an empty result.
Add the account
index=windows sourcetype="WinEventLog:Security" host="FIN-WS-07"
TargetDomainName="LAB" TargetUserName="alex.morgan"
Including the domain helps avoid confusing accounts with the same name. Use the domain value recorded in your events.
Find the failures
index=windows sourcetype="WinEventLog:Security" host="FIN-WS-07"
TargetDomainName="LAB" TargetUserName="alex.morgan" EventCode=4625
Windows Security Event 4625 records a failed logon. Inspect the source address, logon type, and failure details; not every failure means a wrong password. Microsoft’s 4625 reference.
The habit is simple: run a small search, inspect it, add one filter, run it again. Then you know which step removed the results.
7. Make the Results Easier to Read
Once the events make sense, display the useful fields:
index=windows sourcetype="WinEventLog:Security" host="FIN-WS-07"
TargetDomainName="LAB" TargetUserName="alex.morgan" EventCode=4625
| table _time host TargetUserName IpAddress LogonType Status SubStatus
| sort 0 _time
Only two new ideas:
| tablechooses which fields to display.| sort 0 _timeputs all matching rows in time order. Use this on tightly scoped results, since sorting everything can be expensive.
The pipe | means “take these results and do the next step.” Remove the table command when you need the complete original event.
To count failures by source IP, replace the table and sort lines with:
| stats count BY IpAddress
| sort - count
That fragment goes after the same failed-logon search, not into an empty search bar. stats groups events instead of displaying their full sequence. Missing-IP events may be excluded from those groups, so inspect them separately.
If your count differs from the ticket’s 24 failures, compare the rule’s exact window and filters, and check for duplicate collection. Do not force your search to match the expected number.
8. Did Any Logon Succeed?
Include both failures and successes:
index=windows sourcetype="WinEventLog:Security" host="FIN-WS-07"
TargetDomainName="LAB" TargetUserName="alex.morgan"
(EventCode=4624 OR EventCode=4625)
| table _time EventCode host TargetUserName IpAddress LogonType
| sort 0 _time
Windows Security Event 4624 records a successful logon session on the accessed computer. It does not necessarily mean a person entered the desktop. Logon type 3 is network access; type 10 is remote interactive access. Microsoft’s 4624 reference.
Our fictional results show:
| Time (UTC) | What the events show |
|---|---|
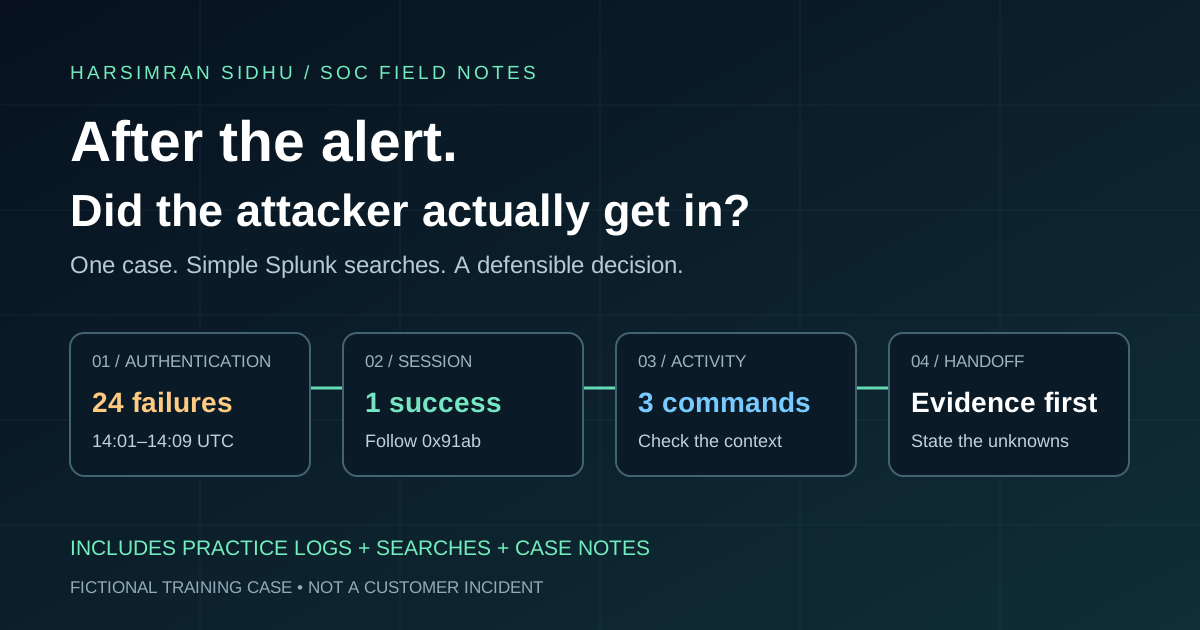
| 14:01–14:09 | 24 failed logons from 198.51.100.44 |
| 14:10:32 | One successful logon for the same account, target, and recorded source |
| 14:11:00 | The failed-logon alert is generated |
That deserves follow-up. It is not proof that an attacker guessed the password. A user could fail and then succeed; a shared source address could represent multiple systems.
Check whether the source is an approved VPN, jump host, service, or unexpected device. Verify ownership at the incident time, inspect the logon type, and contact the user or owner through the approved process.
Ask “Did you access this computer at this time from this device?” rather than just “Is that your account?”
9. Check Whether the Activity Is Wider
A pivot means using something you found to ask the next question.
We found a source IP. Remove the original host and account filters to check for other targets:
index=windows sourcetype="WinEventLog:Security"
IpAddress="198.51.100.44" (EventCode=4624 OR EventCode=4625)
| table _time host TargetDomainName TargetUserName EventCode LogonType
| sort 0 _time
Keep the same window first. Then widen it deliberately if needed—for example, to the preceding day—and record the new range. Do not jump to All time.
One account on one computer and many accounts on many computers need different follow-up. Neither pattern explains intent by itself.
In our example, only the original account and target match. That means no additional matches in the data checked, not “the rest of the company is safe.”
10. Write a Useful Handoff
Separate what you observed from what remains unknown:
Ticket: SOC-2026-0903-017
Window: 2026-09-03, 14:00–14:20 UTC
Data: Windows Security events in index=windows

Observed:
24 failed logons for LAB\alex.morgan on FIN-WS-07 from 198.51.100.44.
A successful logon follows at 14:10:32 from the same recorded address.
No other account or target matched the source-IP search in this window.

Assessment:
Suspicious sequence; unauthorized access is not yet confirmed.
Need source ownership, logon-type context, and user verification.

Next:
Escalate for follow-up. Verify whether access was expected.
Review activity after the successful logon with endpoint/identity data.
Use the response playbook if evidence warrants containment.

Evidence:
Attach searches, timezone, raw event references, and findings.
Do not mark a requested action completed until it is confirmed.
If the activity is verified as expected and the evidence matches, document why. If it is unauthorized, follow the response playbook. If essential logs are missing, say inconclusive and explain the gap. Missing data is not a reason to call an alert benign.
When a Search Returns Nothing
Check these in order:
- Time: correct window and timezone?
- Index: a real name from your environment?
- Sourcetype: the log type you need?
- Host/account: short name, full name, domain, or collector value?
- Fields: do those names exist in your events?
- Visibility: collection, ingestion delay, retention, or permissions?
Remove one filter at a time. If results reappear, inspect the actual values. If logs are delayed, rerun the same fixed incident window later.
The Pattern to Remember
Find the index → identify the log type → read an event → add filters → follow the next question.
A different alert changes the data you need: sign-ins lead toward authentication logs, suspicious domains toward DNS/proxy logs, and suspicious programs toward endpoint logs.
You can learn advanced SPL later. First, get comfortable explaining where your evidence came from, what each search answered, and what you still do not know.